research question
How does oxygen content and temperature in water differ in locations of the Nong Bon Retention Pond in the middle of the reservoir, close to a power outlet, and in a canal?
background information
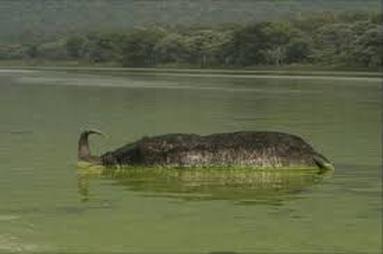
The cause impairment or the damage of coastal marine and freshwater on the ecosystem in the world is called eutrophication. Eutrophication occurs naturally over centuries where plant and algae grows excessively from photosynthetic factors such as carbon dioxide, sunlight and nutrient fertilizer [1]. The accumulation of nutrients from fertilizers and other waste that are flushed into bodies of water. The increase in nitrate or phosphate from the fertilizers forms a major contribution to the growth of plankton and algae [1,2]. This newly formed algae layer would then block the surface of water, limiting sunlight penetration that would inhibit the photosynthesis and growth of plants, ultimately causing them to die. Microorganisms would then decompose the dead plants, using up most of the dissolved oxygen, and create an anoxic ‘dead zone’ that destroys the ecosystem for life in the area to sustain [1]. Thus, the presence of algae in water bodies have a positive correlation with depletion in oxygen content.
Another correlation that eutrophication has on water bodies is increase in water temperature. Rising temperatures (which is becoming more and more prevalent due to climate change) increases the rate of “nutrient release from soil”, allowing more algae to consume them. They also increase activity of microorganisms such as bacteria to decompose dead aquatic plants, which depletes more dissolved oxygen in the process [3]. Therefore, bodies of water with warmer temperatures are more susceptible to eutrophication.
Another correlation that eutrophication has on water bodies is increase in water temperature. Rising temperatures (which is becoming more and more prevalent due to climate change) increases the rate of “nutrient release from soil”, allowing more algae to consume them. They also increase activity of microorganisms such as bacteria to decompose dead aquatic plants, which depletes more dissolved oxygen in the process [3]. Therefore, bodies of water with warmer temperatures are more susceptible to eutrophication.
variables
|
Independent
|
Dependent
|
Controlled
|
hypothesis
With eutrophication, the formation of algae and water plants in the water will be an indicator of the level of oxygen content. At areas without much water flow and filtration such as a canal, the oxygen content in the water would be lower, as more algae and water plants may form in the water. Higher temperatures would also benefit eutrophication in the canal. Meanwhile, at areas near a power in/outlet, continued water flow would inhibit algal formation. With least amount of algae forming on the water surface, this allowed more sunlight to passed through the water surface, creating more oxygen in the water and stabilizing the water temperature. As the water flow to the middle part of the reservoir, the water flow at slower or no speed causes more algae and water plants to form on the water surface relative to one close to a power outlet. This means that less sunlight will be able to pass through the water surface and creating less oxygen content in the water.
materials
|
|


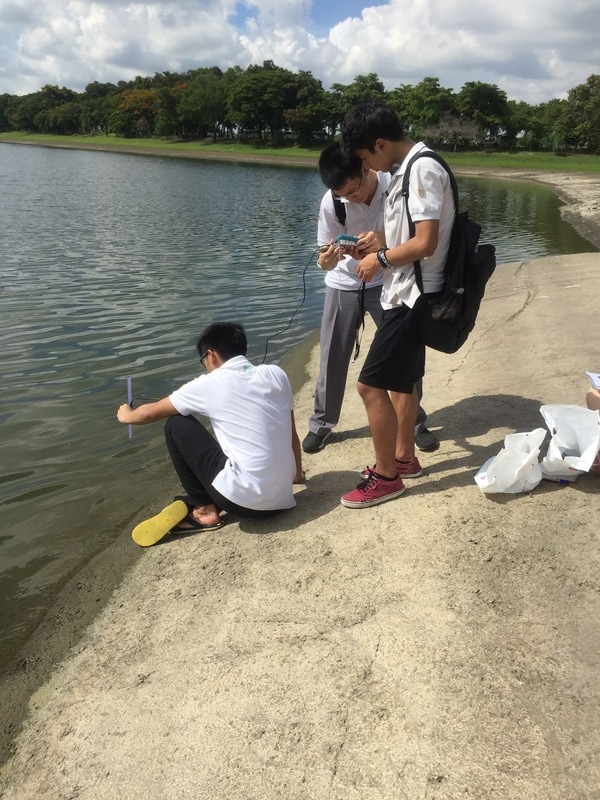
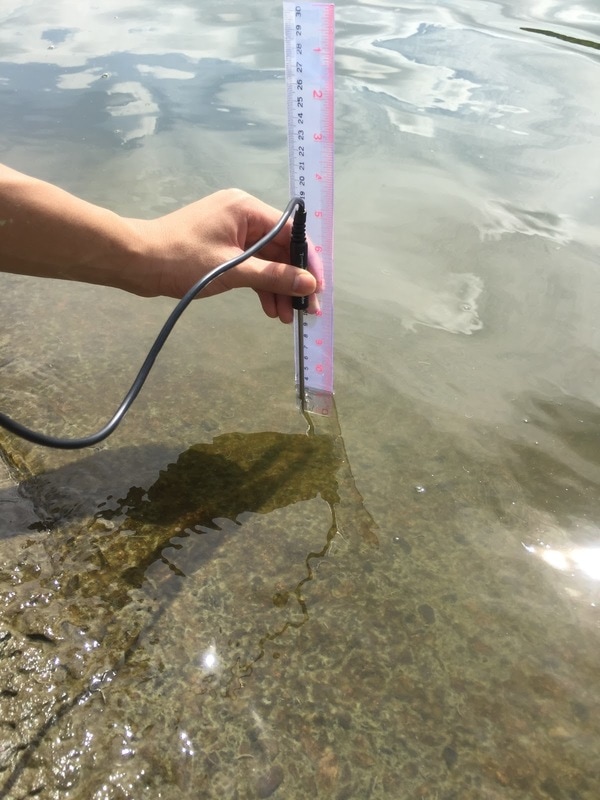
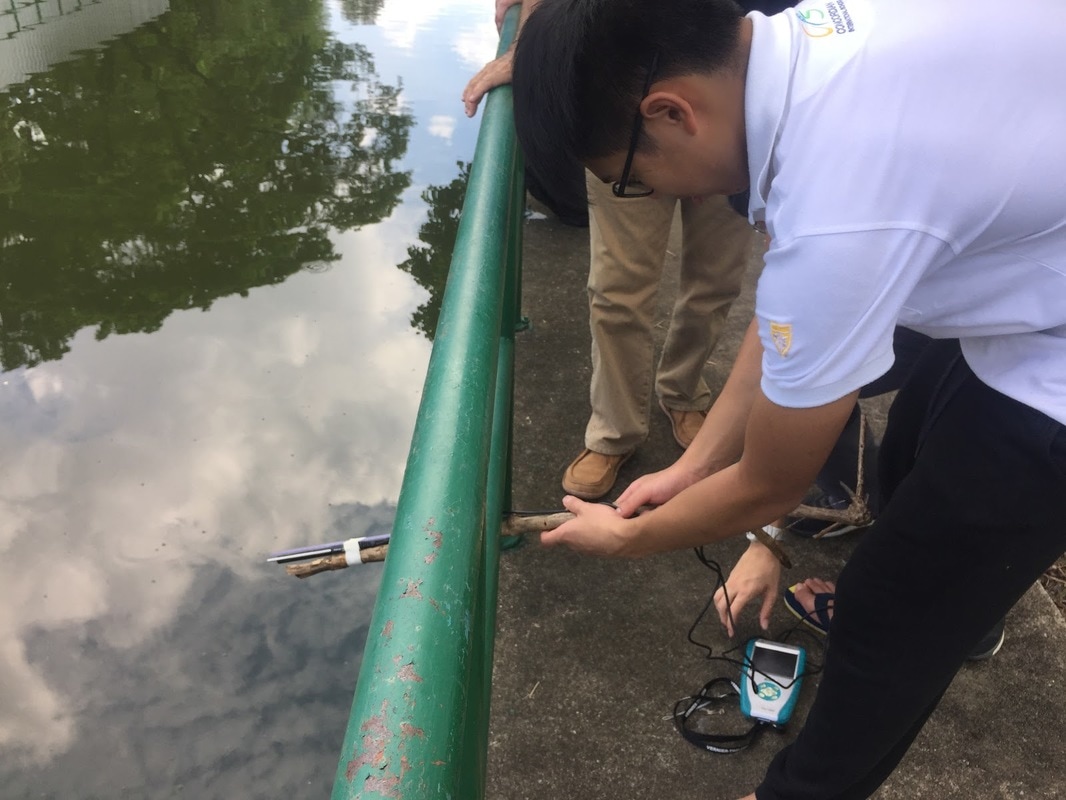
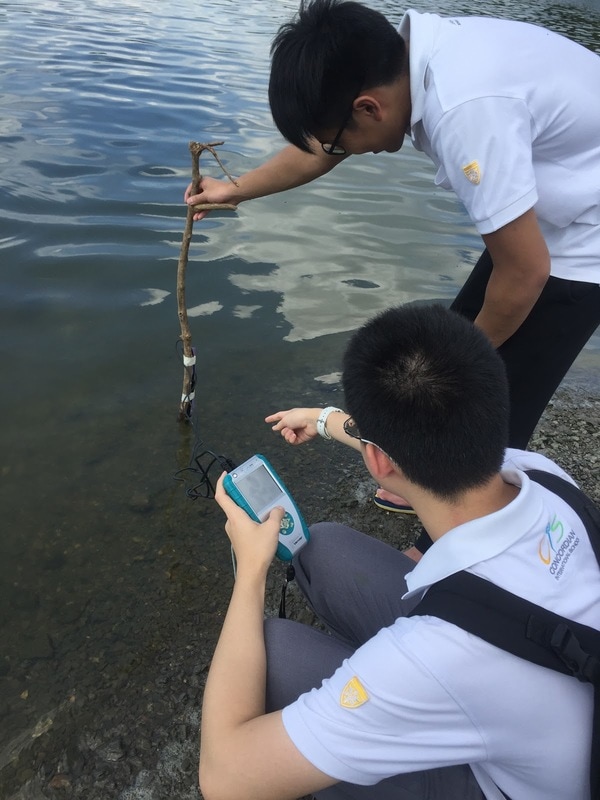
method
|
|
analysis
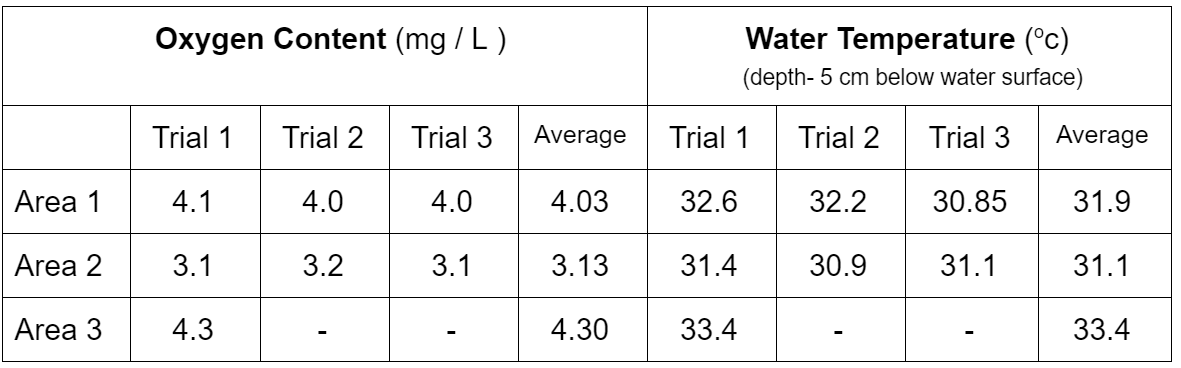
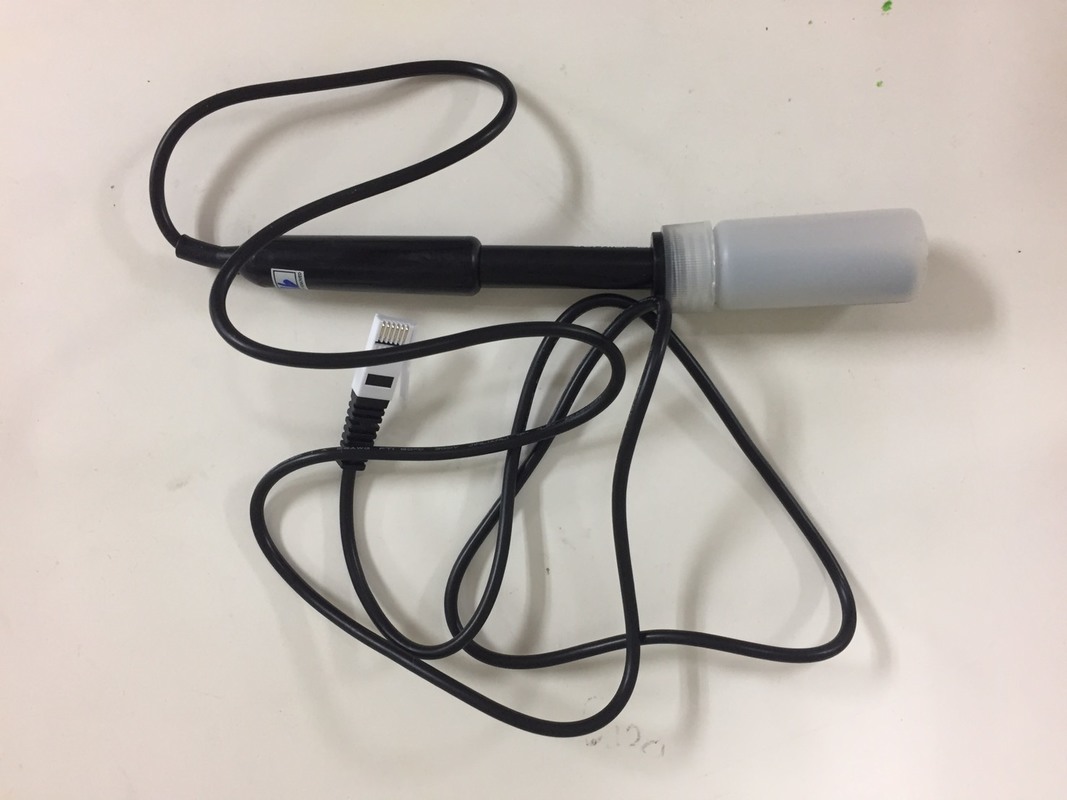
Table 1: Mean oxygen content (mg/L) and water temperature (oC) in trials and averages in Areas 1, 2, and 3 of Nong Bon Retention Pond
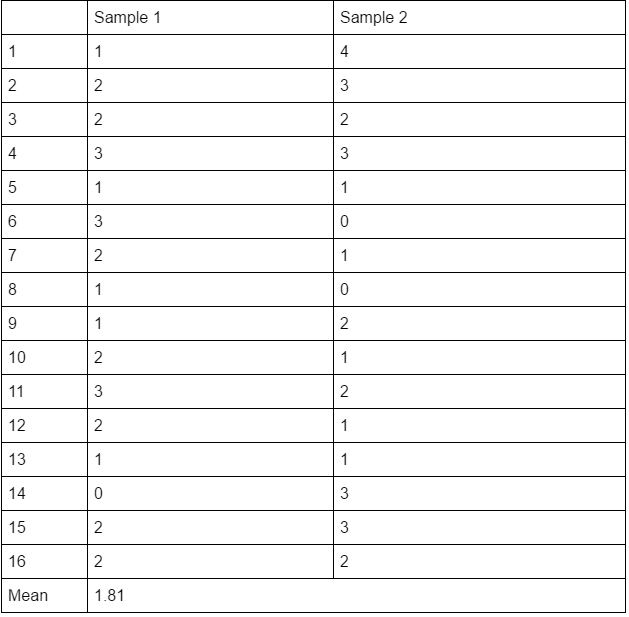
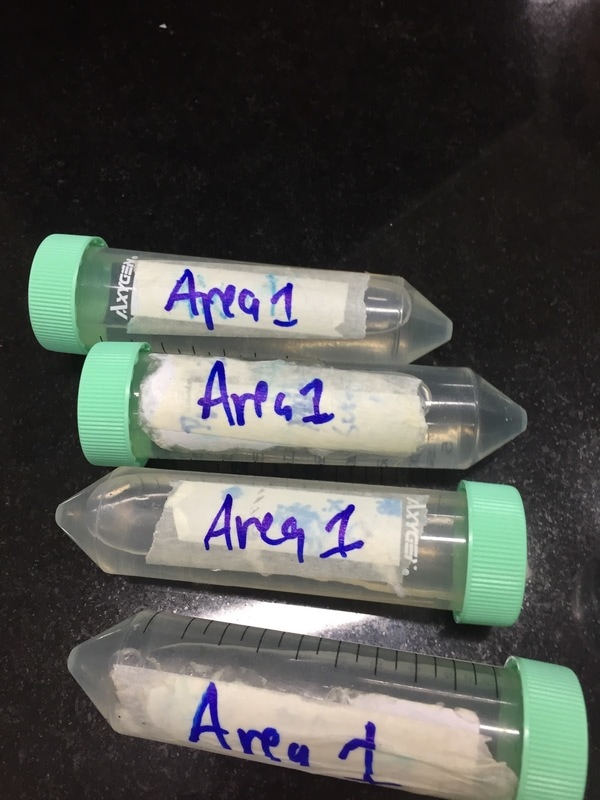
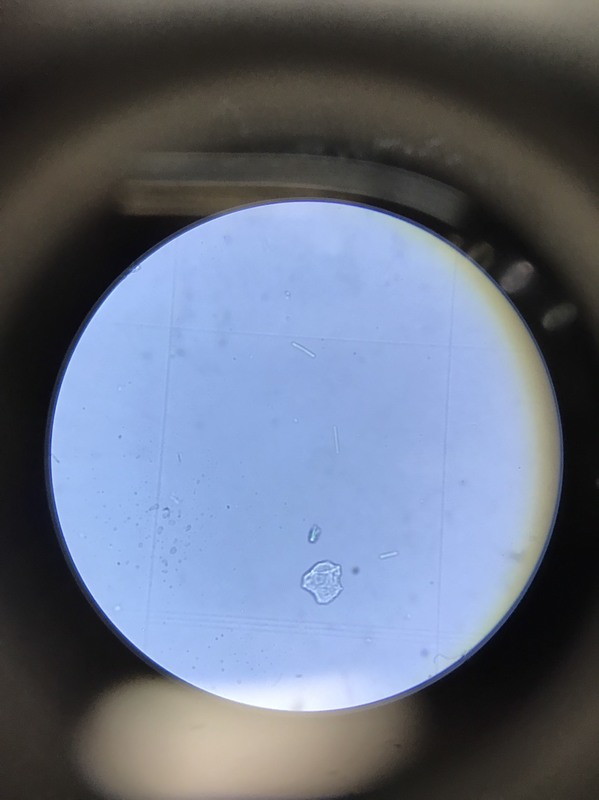
Table 2: The mean population density of algal drops and microorganisms per 0.1 mm2 as measured through two samples of Area 1, each containing 16 drops
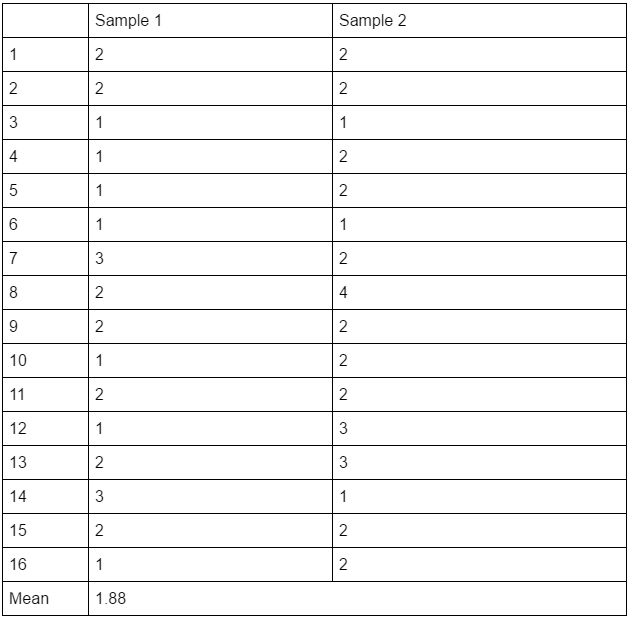
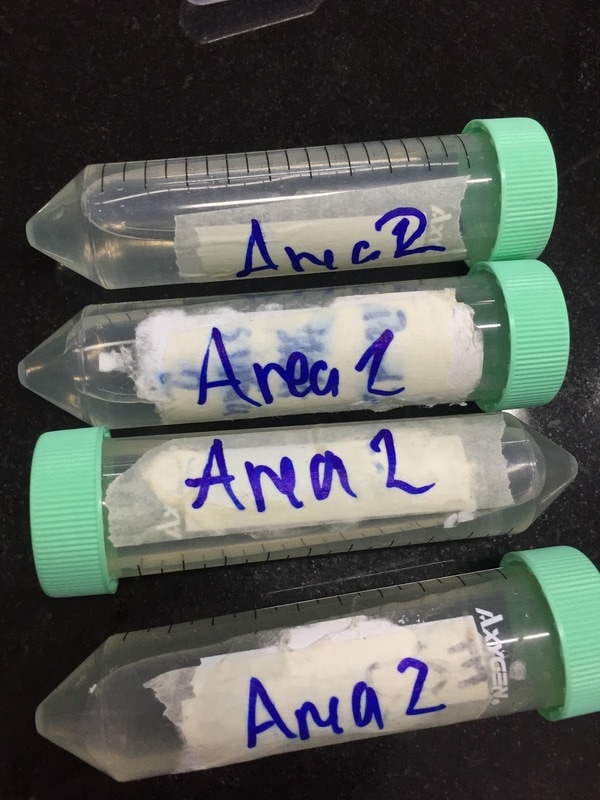
Table 3: The mean population density of algal drops and microorganisms per 0.1 mm2 as measured through two samples of Area 2, each containing 16 drops
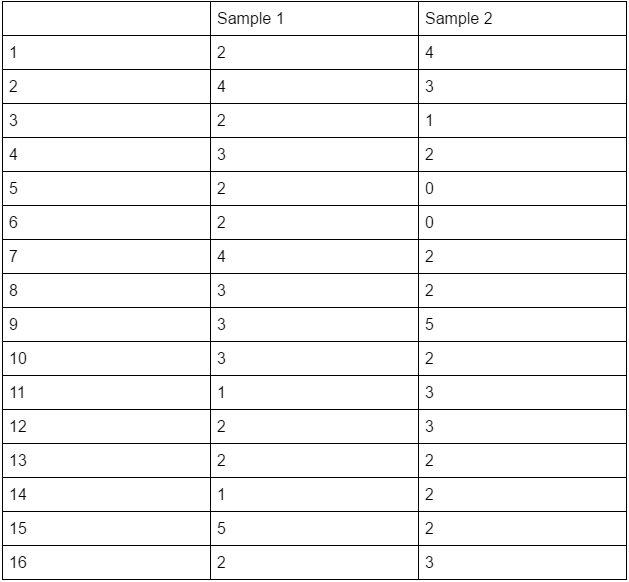
Table 3: The mean population density of algal drops and microorganisms per 0.1 mm2 as measured through two samples of Area 3, each containing 16 drops
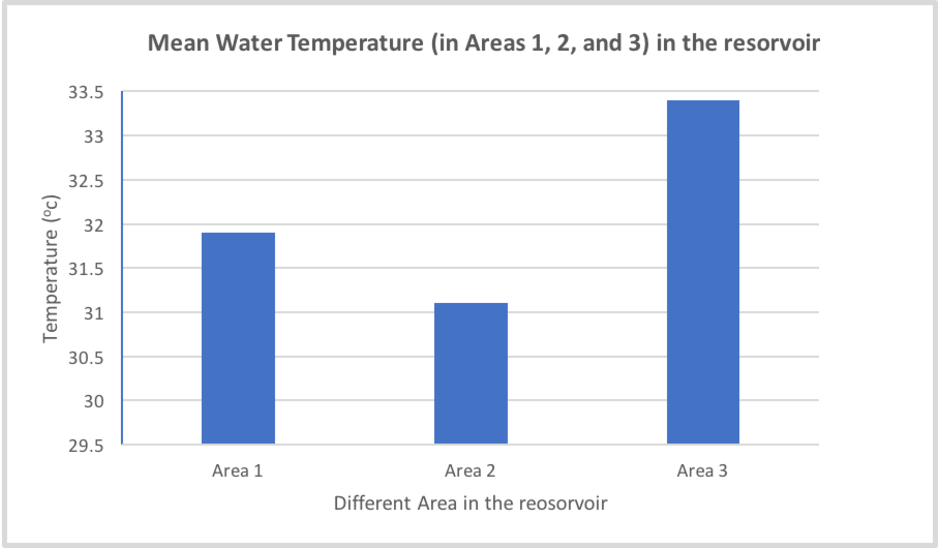
Graph 1: Mean water temperature (C) in Areas 1, 2, and 3 in Nong Bon Retention Pond
Graph 1 shows the differences of water temperature in the different area of the reservoir. Area 3, where the water temperature measured is at the middle of the water reservoir, has the highest water temperature of all three areas, with the average water temperature at 33.4 C. Area 3, where the water temperature measured at the canal before water flows into the water gate, has the lowest water temperature of all three area, with the average water of 31.1 C. In Area 1 where the water temperature was measured nearby the water outlet, the temperature of the water tends to be higher than Area 2, but still lower than Area 3, with the average water temperature of 31.1 C.
Graph 1 shows the differences of water temperature in the different area of the reservoir. Area 3, where the water temperature measured is at the middle of the water reservoir, has the highest water temperature of all three areas, with the average water temperature at 33.4 C. Area 3, where the water temperature measured at the canal before water flows into the water gate, has the lowest water temperature of all three area, with the average water of 31.1 C. In Area 1 where the water temperature was measured nearby the water outlet, the temperature of the water tends to be higher than Area 2, but still lower than Area 3, with the average water temperature of 31.1 C.
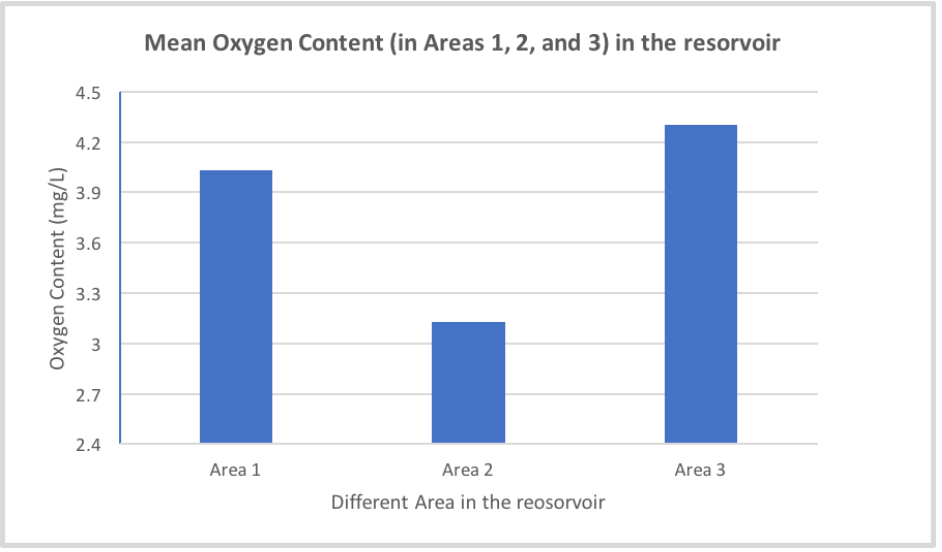
Graph 2: Mean dissolved oxygen content (C) in Areas 1, 2, and 3 in Nong Bon Retention Pond at a depth of 5 cm
Graph 2 shows the differences in the mean of dissolved oxygen content in the different area of the water reservoir. Area 3 has the highest dissolved oxygen content, with more than average of 4.30 mg/L oxygen content in the water. Water in Area 2 contains the lowest dissolved oxygen content of all three areas, with the average of only 3.13 mg/L oxygen content in the water. Dissolved oxygen content in Area 1 is much higher than in Area 2 (at 4.03 mg/L).
Graph 2 shows the differences in the mean of dissolved oxygen content in the different area of the water reservoir. Area 3 has the highest dissolved oxygen content, with more than average of 4.30 mg/L oxygen content in the water. Water in Area 2 contains the lowest dissolved oxygen content of all three areas, with the average of only 3.13 mg/L oxygen content in the water. Dissolved oxygen content in Area 1 is much higher than in Area 2 (at 4.03 mg/L).
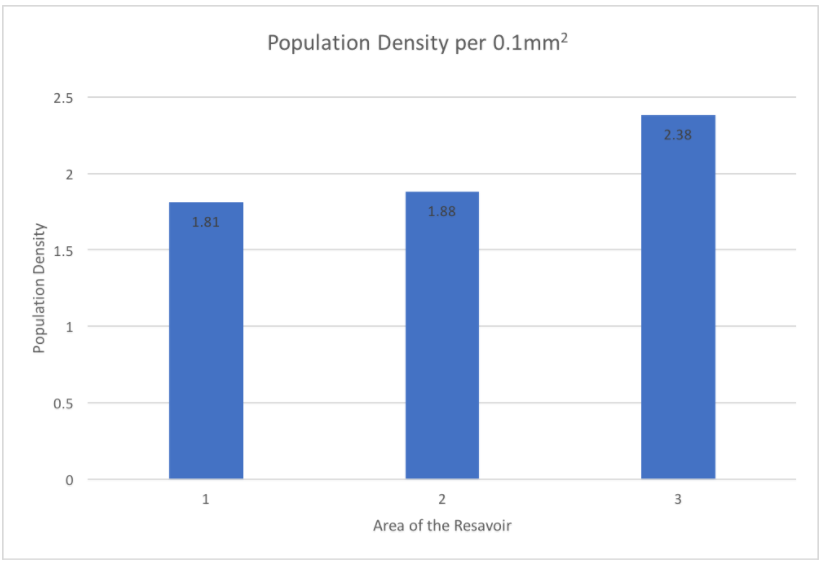
Graph 3: Mean population density of algae and microorganisms (number of organisms per 0.1 mm2) in Areas 1, 2, and 3
In Area 1 nearby the power outlet, the water contains the lowest population of algae and water plant density, with less than 1.81 population per 0.1 mm2. Area 3 contains the highest population of algae and water plant density, with more than 2.38 population per 0.1mm2. Meanwhile, Area 2 remains moderate as an average of 1.88 organisms per 0.1 mm2.
In Area 1 nearby the power outlet, the water contains the lowest population of algae and water plant density, with less than 1.81 population per 0.1 mm2. Area 3 contains the highest population of algae and water plant density, with more than 2.38 population per 0.1mm2. Meanwhile, Area 2 remains moderate as an average of 1.88 organisms per 0.1 mm2.
evaluation
Conclusion
Strengths and Weaknesses
Improvements and Extensions
Strengths and Weaknesses
Improvements and Extensions
references
[1.] Chislock MF, Doster E, Zitomer RA, Wilson AE. Eutrophication: Causes, Consequences, and Controls in Aquatic Ecosystems. Nature News; 2013 [accessed 2017 Jun 6]. Available from: https://www.nature.com/scitable/knowledge/library/eutrophication-causes-consequences-and-controls-in-aquatic-102364466
[2.] GCSE Bitesize: eutrophication. BBC; 2014 [accessed 2017 Jun 6]. Available from: http://www.bbc.co.uk/schools/gcsebitesize/science/edexcel/problems_in_environment/pollutionrev4.shtml
[3.] Havens K. Effects of climate change on the eutrophication of lakes and estuaries. EDIS; 2012 Sep [accessed 2017 Jun 6]. Available from: http://edis.ifas.ufl.edu/sg127
